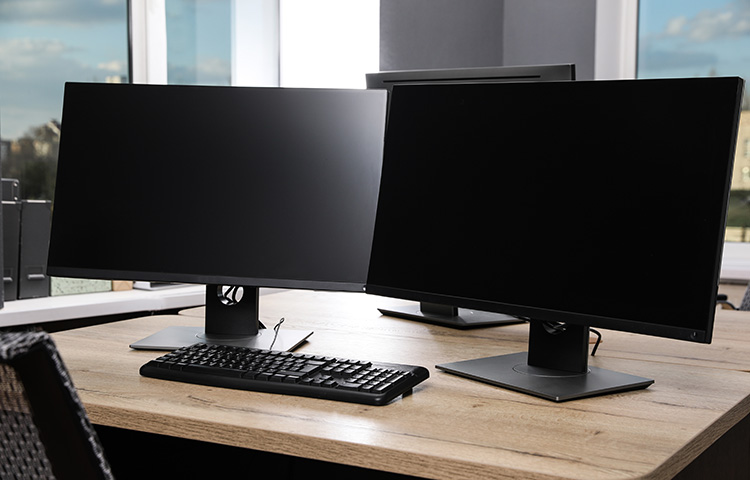
In recent years, LCDs (liquid crystal DISPLAY) have become ubiquitous in our daily lives. Because LCDs are products that display images, they are modular products for which light and color characteristics are extremely important. In this article, we will use our own measuring equipment to evaluate and explain the actual LCD characteristics.
1. Optical characteristics of LCD
If you look at an LCD datasheet, you will see that in addition to electrical characteristics, there is also an item called optical characteristics. Optical characteristics quantitatively specify the brightness and color of the LCD, and are very important characteristics that determine the appearance of the LCD.
Brightness
White Luminance is an indicator of the brightness of DISPLAY.
It is measured in units of cd/m² (candela per square meter) or nit, where 1 cd/m² = 1 nit.
LCD manufacturer data sheets often specify the brightness value at the center of the LCD. Normally, brightness is a design guarantee value, so manufacturers do not inspect every unit before shipping, and data sheets generally do not specify a maximum value.
| Parameter | Condition | Min | Type | Max | Unit |
|---|---|---|---|---|---|
| White Luminance | Center Point | 300 | 350 | - | [cd/m2] |
Table 1. Examples of brightness descriptions
The data sheet defines the specific measurement method for each parameter.
Figure 1 is just an example, but the measurement conditions shown in the illustration are also listed in the data sheet.
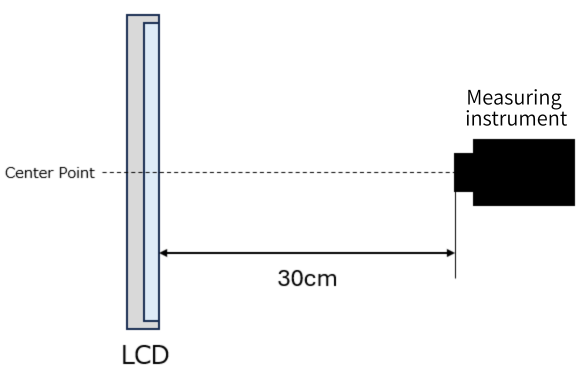
Figure 1. Example of luminance measurement conditions
Now, let's actually measure the optical properties using an LCD we have around us. This time, we will check the properties of a laptop computer for a simple measurement. The photo has room lights on to make it easier to see, but optical properties are usually measured in a darkroom.
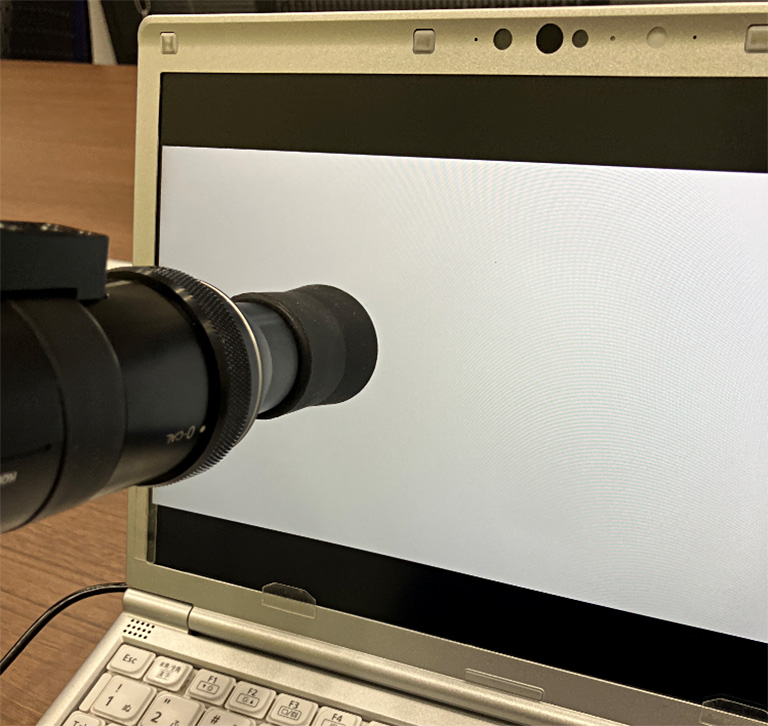
Figure 2: Luminance measurement
When we measured the brightness on a white (R: 255, G: 255, B: 255) screen using the standard Windows Paint tool, the result was 236.8 [nits]. Typically, the screen brightness of a laptop is around 200-400 [nits], so we can say that the brightness is roughly correct.
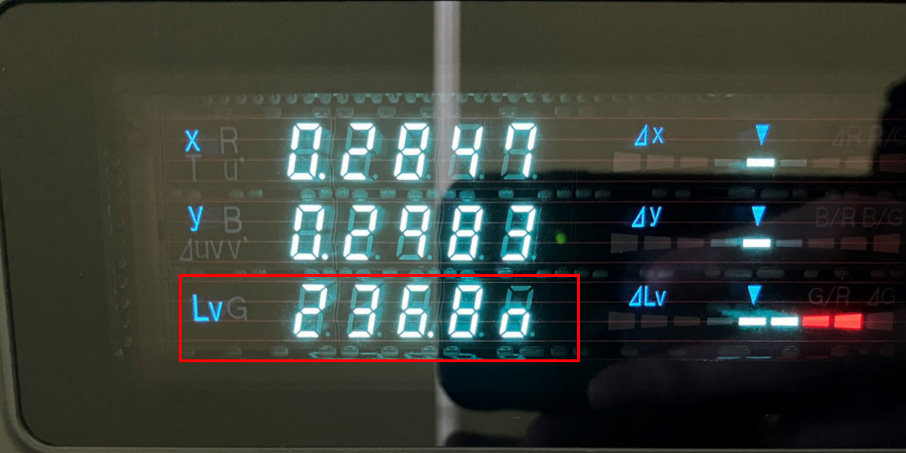
Figure 3: Brightness measurement results for a laptop computer
Chromaticity
Chromaticity is an index that quantitatively represents the characteristics of a color.
In LCDs, it is common to express color using a graph called the xy chromaticity diagram, which was established by the CIE (International Commission on Illumination).
The xy chromaticity diagram is a graph that converts colors in the human visible range into numerical values and displays them as color coordinates (Figure 4). LCD data sheets specify the characteristics of red, green, blue, and white using coordinate values.
| Parameter | Condition | Min | Type | Max | Unit |
|---|---|---|---|---|---|
| Color Chromaticity (CIE 1931) | Red x | 0.570 | 0.620 | 0.670 | - |
| Red y | 0.226 | 0.276 | 0.326 | ||
| Green x | 0.237 | 0.287 | 0.337 | ||
| Green y | 0.526 | 0.576 | 0.626 | ||
| Blue x | 0.096 | 0.146 | 0.196 | ||
| Blue y | 0.030 | 0.080 | 0.130 | ||
| White x | 0.250 | 0.300 | 0.350 | ||
| White y | 0.270 | 0.320 | 0.370 |
Table 2. Examples of brightness descriptions
LCDs can only display colors within the chromaticity range specified in their datasheets. Figure 5 shows the chromaticity (typical values) in Table 2 plotted on the CIE1931 color space. LCDs can display any color within the range enclosed by the three sides of the triangle.
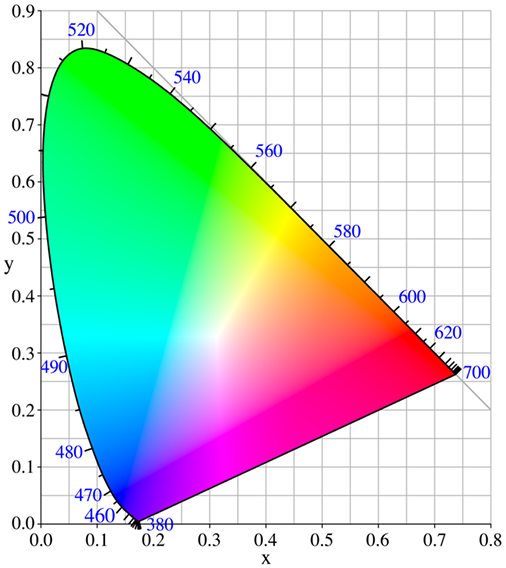
Figure 4 CIE1931 color space
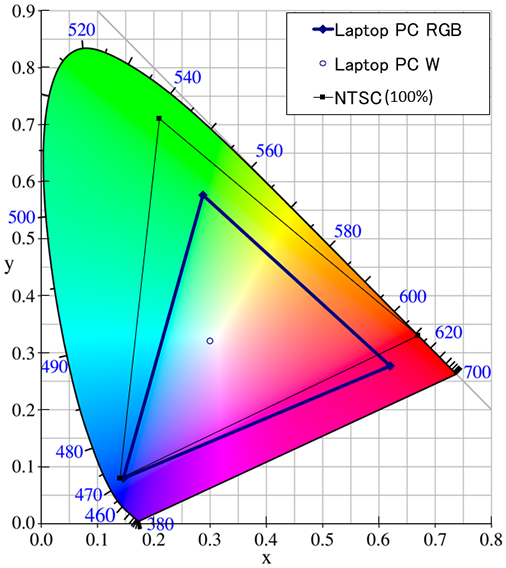
Figure 5. Example of plotting in CIE1931 color space
In the same environment as the luminance measurement above, it is possible to measure chromaticity at the same time. When the chromaticity of red, green, and blue was measured using a paint tool, the results were as shown below. If you plot the measurement results in Figure 4, you can see that they generally match the colors expressed in the CIE1931 color space.
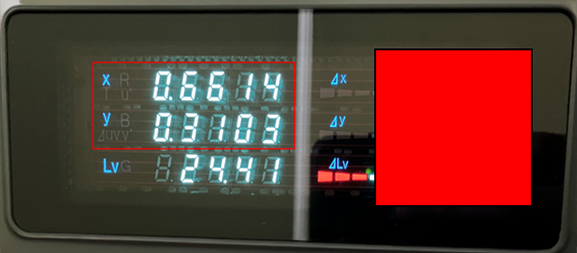
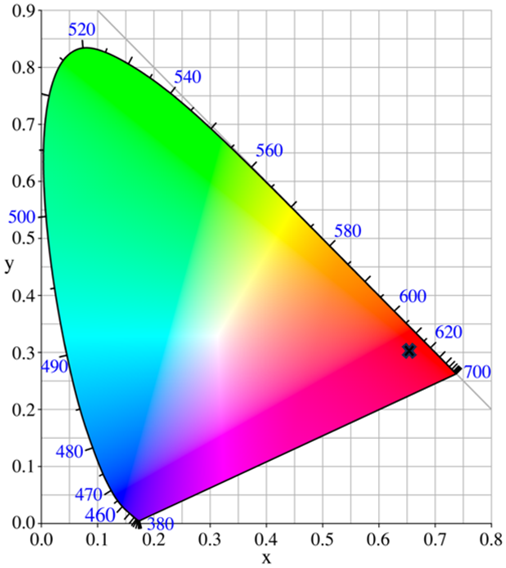
Figure 6. Measurement results for red (R: 255)
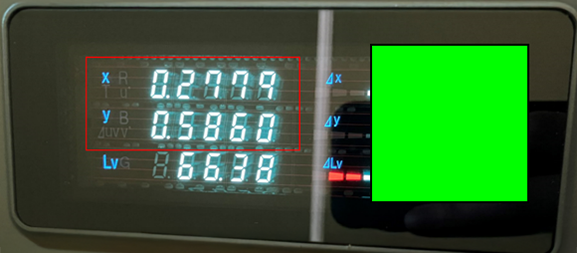
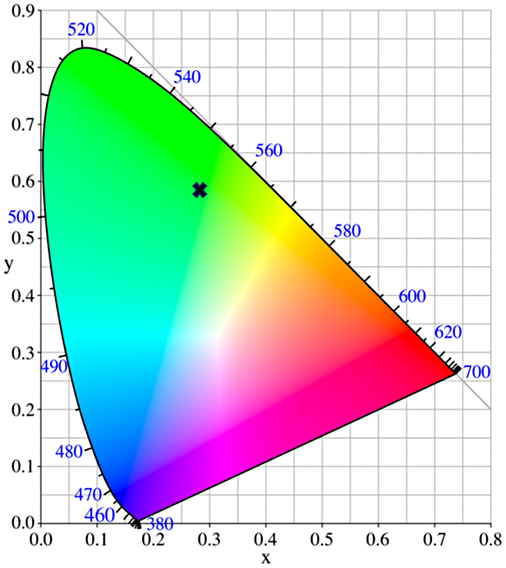
Figure 7 Measurement results for green (G: 255)
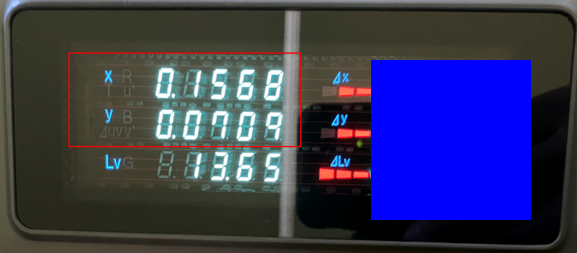
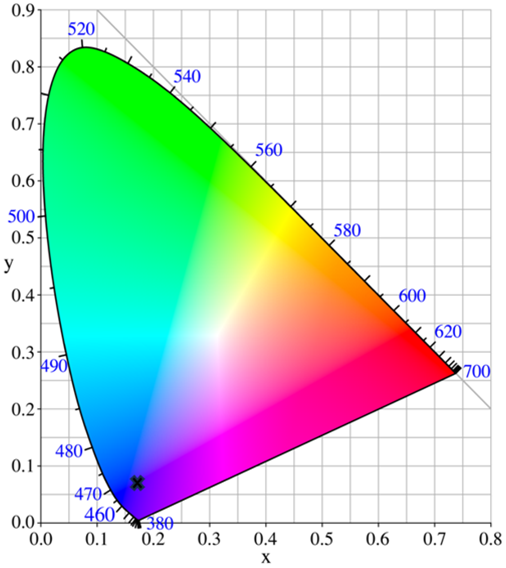
Figure 8. Measurement results for blue (B: 255)
Color gamut
Color gamut is a numerical index of the extent to which an LCD can reproduce colors. Color gamut is based on the color coordinates established for color televisions by the NTSC (National Television System Committee). It is calculated as the area ratio of the color reproduction area that an LCD can reproduce to the NTSC color reproduction area. Earlier, a triangle was created on the graph by plotting chromaticity on the CIE1931 color space; the ratio of the area of this triangle to the area of the NTSC standard triangle is defined as the color gamut.
On data sheets, this is expressed as a percentage, as shown below. The color gamut value varies depending on the LCD, but the higher this value, the wider the color reproduction range and the more colors can be reproduced. Since the color gamut is a design-guaranteed value determined by the thickness of the color FILTERS, min/max values are generally not specified on data sheets.
| Parameter | Condition | Min | Type | Max | Unit |
|---|---|---|---|---|---|
| Color Gamut | - | - | 60 | - | % |
Table 3. Examples of color gamut descriptions
Let's look at Figure 5 again.
The triangle surrounded by "NTSC (100%)" is the reference color gamut, and the area ratio of the triangle surrounded by "Laptop PC RGB" is 66%, so the color gamut in this case is 66%.
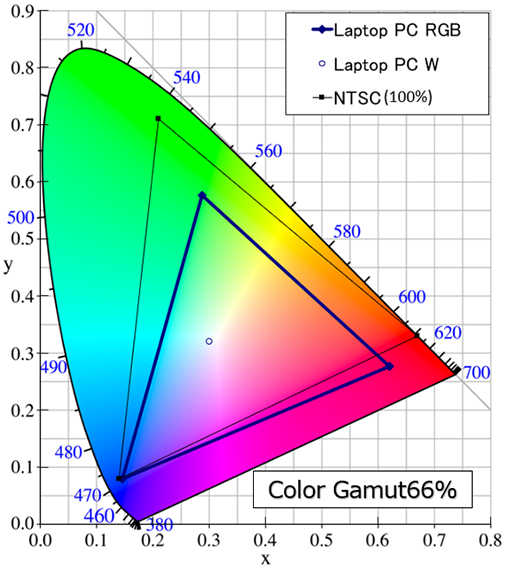
Figure 9 Example of 66% Color Gamut
Contrast
Contrast ratio refers to the brightness ratio of an LCD. It is a value calculated as the ratio between the brightness of white display and the brightness of black display, and is expressed as follows on datasheets. The higher the contrast, the clearer and sharper the image will be. Contrast is important in environments where visibility is required, such as in medical settings and outdoor use.
| Parameter | Condition | Min | Type | Max | Unit |
|---|---|---|---|---|---|
| Contrast ratio | - | 800 | 1000 | - | - |
Table 4. Examples of contrast descriptions
Viewing angle
Viewing angle refers to the angle at which color change and contrast become greater than a certain level when viewing an LCD from the top, bottom, left, or right. LCD manufacturer data sheets usually define this as "the angle at which contrast becomes greater than XX," and often use diagrams like the one below. Below is an example of this description for an IPS LCD.
| Parameter | Condition | Min | Type | Max | Unit |
|---|---|---|---|---|---|
| Viewing Angle | Horizontal (Up) | - | 89 | - | degree |
| CR > 15 (Down) | - | 89 | - | ||
| Vertical (Right) | - | 89 | - | ||
| CR > 15 (Left) | - | 89 | - |
Table 5. Examples of viewing angles
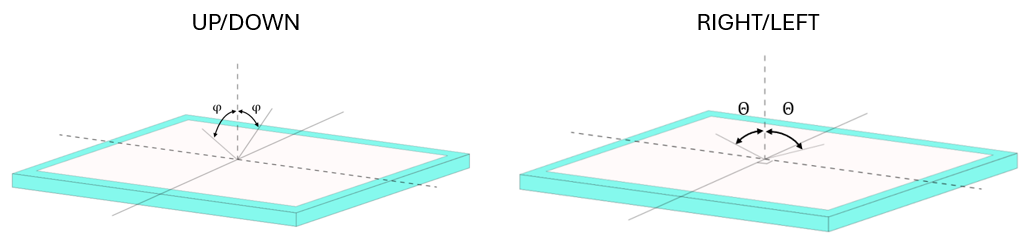
Figure 10 Definition of viewing angle
2. Introduction of our measurement equipment
We would like to introduce the measuring equipment we have in our possession.
DISPLAY Color Analyzer CA-310
- Konica Minolta DISPLAY color analyzer
- Brightness ranges from 0.0001 to 1000 nits, and chromaticity can be displayed in four digits.
- By attaching a light-shielding tube to the dedicated probe, the influence of ambient light is reduced, enabling accurate measurements.
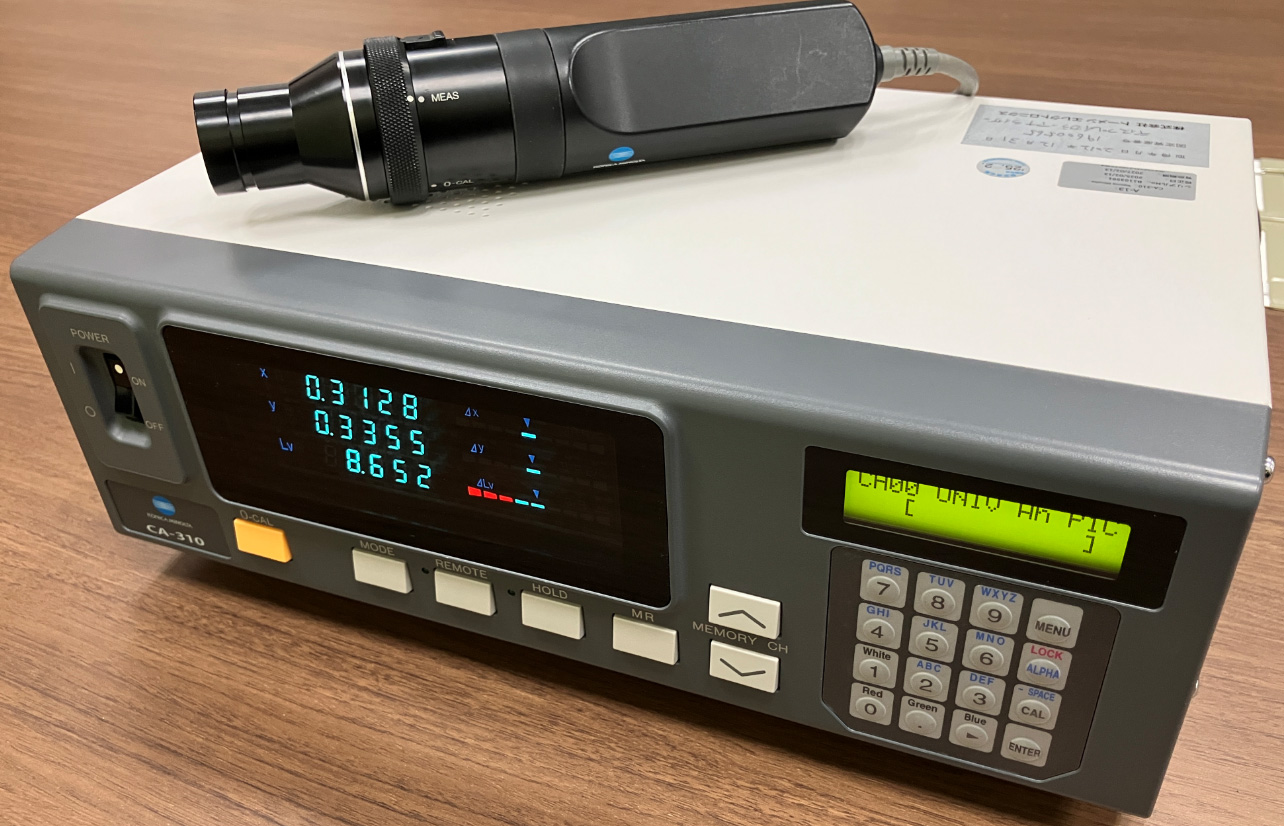
Figure 11 DISPLAY Color Analyzer CA-310
Cosmo Electronics V-by-One compatible lighting device
- Outputting images for LCD display using V-by-One
- By using a conversion board, video input that matches the LCD input interface (LVDS, etc.) is possible.
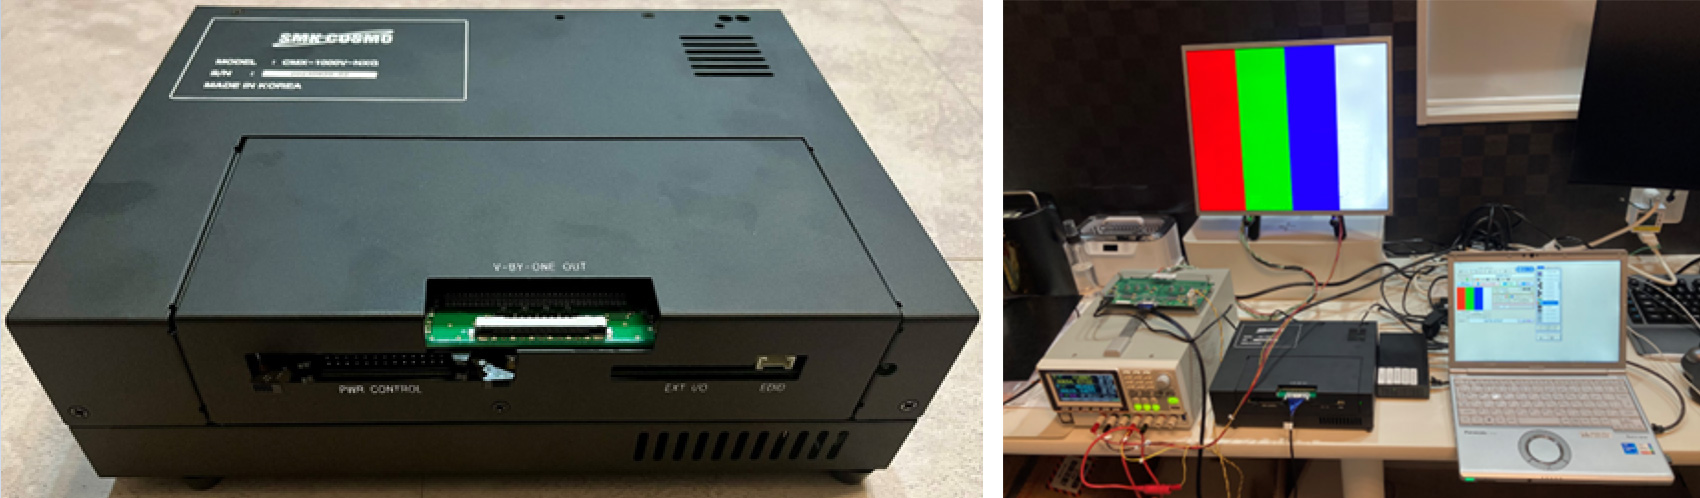
Figure 12 V-by-one compatible lighting device and LCD lighting
Sekonic illuminance meter C-7000
- Sekonic spectrophotometer
- Portable device capable of displaying and recording measurement values and even displaying graphs
- It is possible to obtain the measurement environment illuminance when measuring LCD.
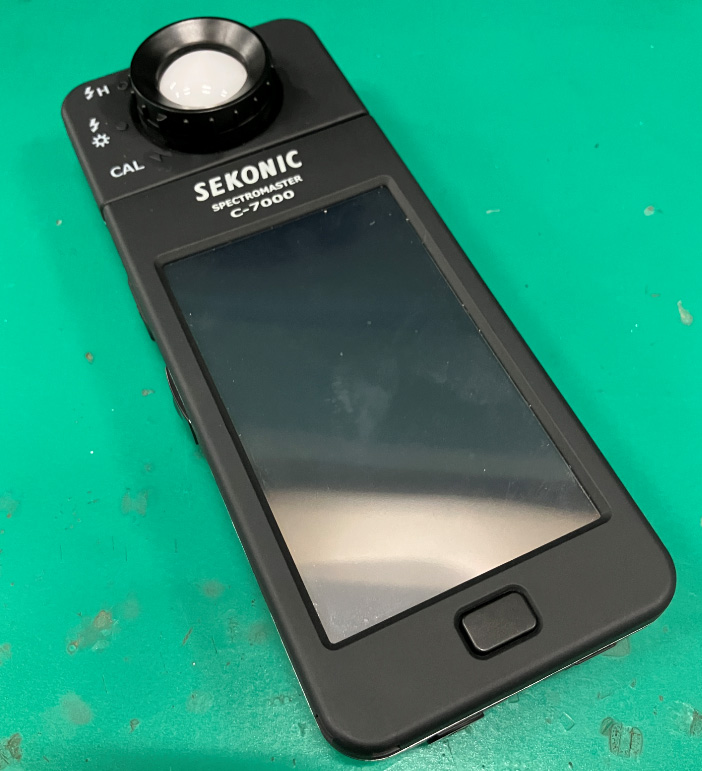
Figure 13. Spectrophotometer C-7000
Summary
Nexty Electronics can propose the optimal LCD panel from multiple LCD suppliers. In addition to product proposals, we can also provide consultation on evaluation using measuring equipment such as those introduced here, so please feel free to contact us if you have any concerns.