
Note: This technology is currently patent pending.
Overview: Why is "Active Learning" necessary?
Are you blindly training your AI models with massive amounts of data to improve their accuracy?
In reality, a major bottleneck in AI development is not the sheer volume of data, but rather determining "which data is effective for learning." Annotation and retraining take time and money, so wasting resources on ineffective data will reduce the overall efficiency of development.
This tool, developed by Nexty Electronics (hereinafter referred to as "our company"), is based on the concept of Active Learning. This method allows the AI itself to select "data that it does not understand well," so that humans can prioritize annotation.
This tool efficiently identifies data that is likely to contribute to improving model accuracy from tens of thousands of data points by combining "feature dimensionality reduction" and "uncertainty index calculation."
Example of dimensionality reduction mapping using t-SNE on MNIST data
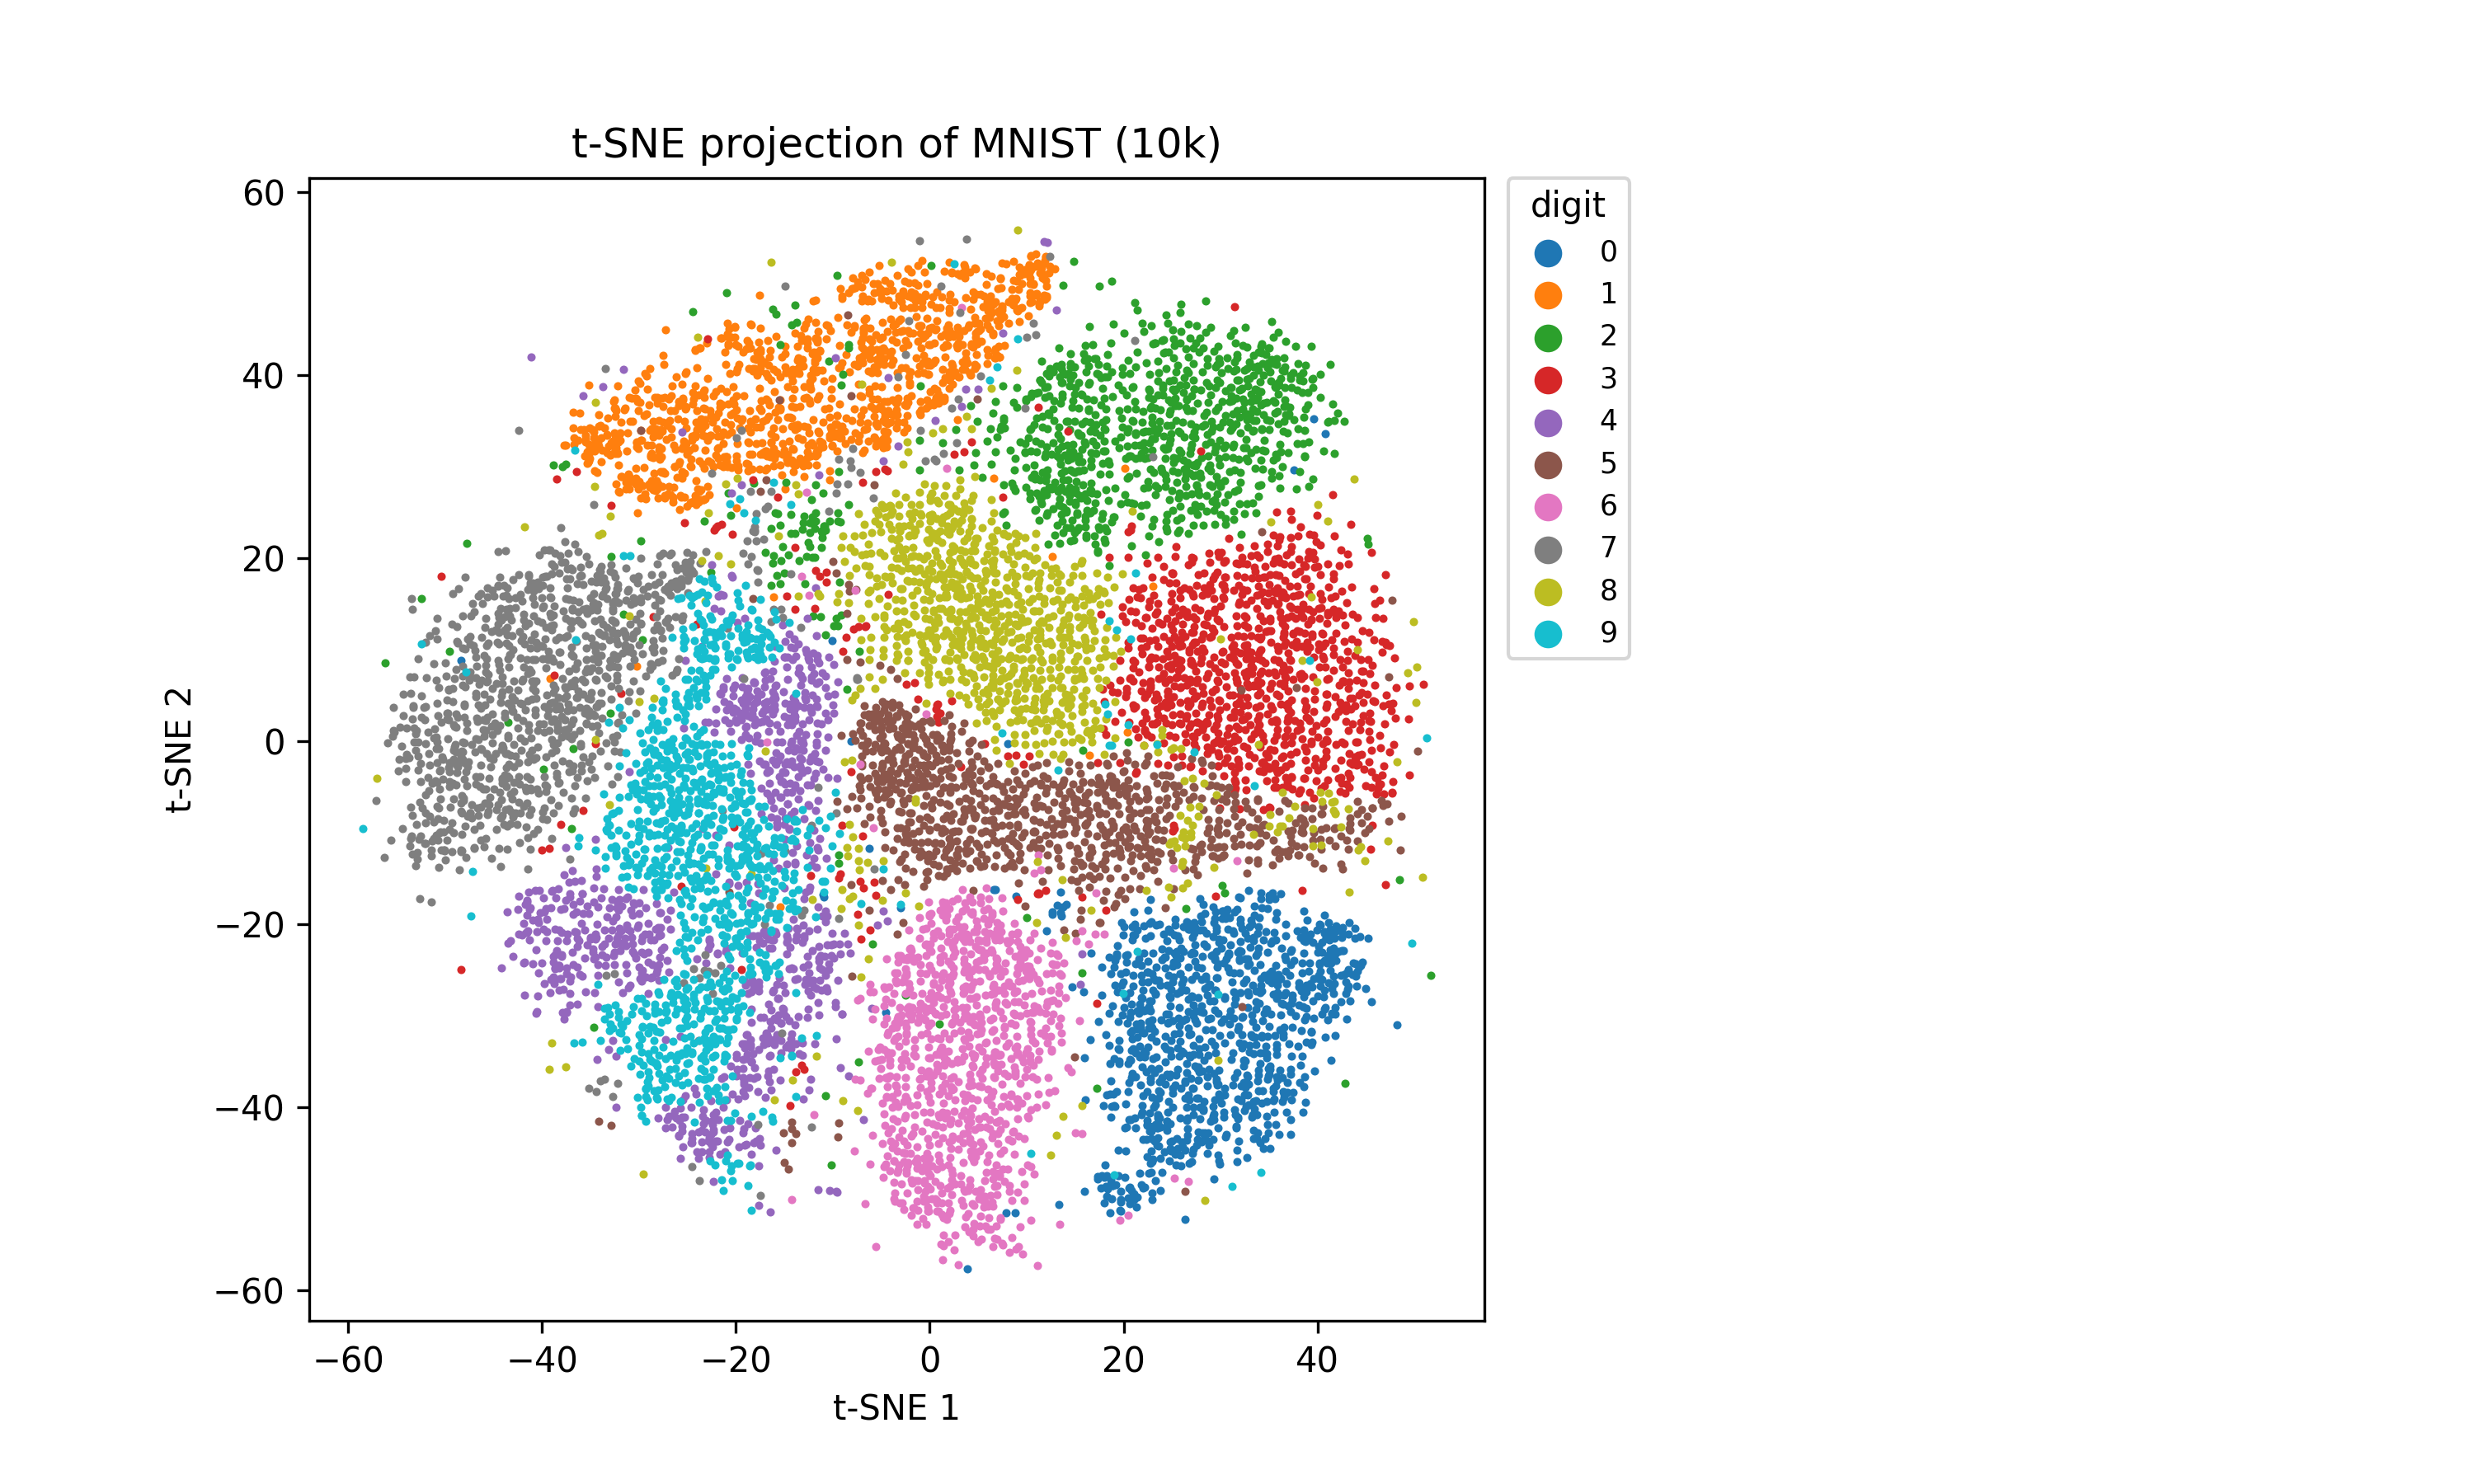
This image visualizes the vast number of features from the MNIST handwritten digit dataset, compressed into two dimensions using the t-SNE algorithm.
Basic way of viewing the mapping
-
Meaning of the dot:
Each point on the graph corresponds to a single image file. -
Meaning of colors:
The data is color-coded according to the type of number. When data with the same number is grouped together, clusters are formed. -
Meaning of distance:
Points located close together on a 2D plane indicate that the AI has determined the data to be "similar in shape and characteristics."
The "thinking" of AI that can be gleaned from this diagram
-
Cluster isolation
Numbers like 0 and 1, which form distinct blocks separate from other colors, are easily recognizable data for AI because they have clear characteristics. -
Cluster overlap
Areas where colors are mixed can be seen at the boundaries between 3 and 8, or 4 and 9. These are areas where the AI perceives the shapes as similar and difficult to distinguish. This is a weak point that can easily lead to misidentification. -
Isolated points
Points that exist separately from larger clusters may be numbers with strong handwriting characteristics or special data containing noise.
Applications in Active Learning tools: Efficient data selection
Our "Active Learning tool" goes beyond mere analysis, utilizing this visualization for strategic selection of learning data.
Identifying uncertainty
In object detection, the more confused the model is with the data, the less stable the results tend to be when inference is repeated.
-
Data in boundary regions where clusters are intermingled on a map tends to have higher uncertainty.
-
By prioritizing the extraction of such data and using it for additional training, we can efficiently improve accuracy with a minimal amount of data.
Completing cluster gaps
When the distribution of trained data and the distribution of untrained data are overlaid, "gap zones" become visible between existing clusters.
By intensively training the model with data that fills in these gaps, we can reduce the model's blind spots and move closer to creating a robust AI that is strong in corner cases.
Visualization using t-SNE provides a map-like representation of how AI features are captured, which can often be a black box. Targeting areas of high uncertainty on this map during training is a shortcut to developing highly accurate models.
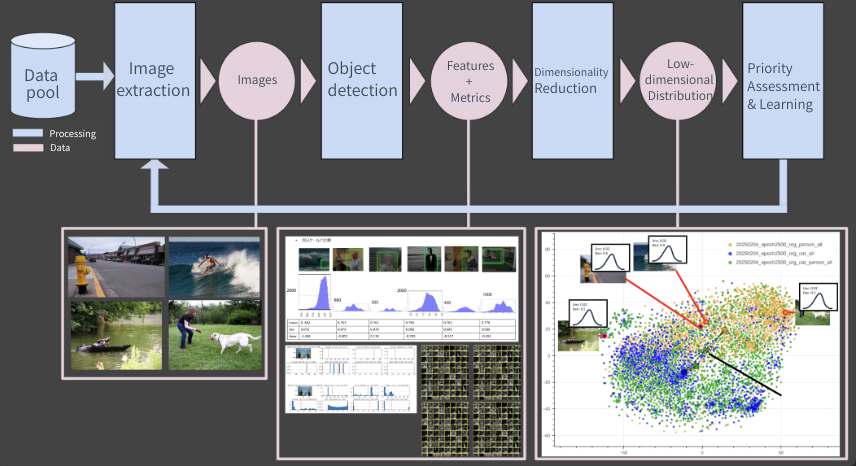
Web UI image
The following is an example of a development screen for the Active Learning tool. You can narrow down the candidates to add to the training process by checking the distribution and uncertainty of the data on the visualization map.
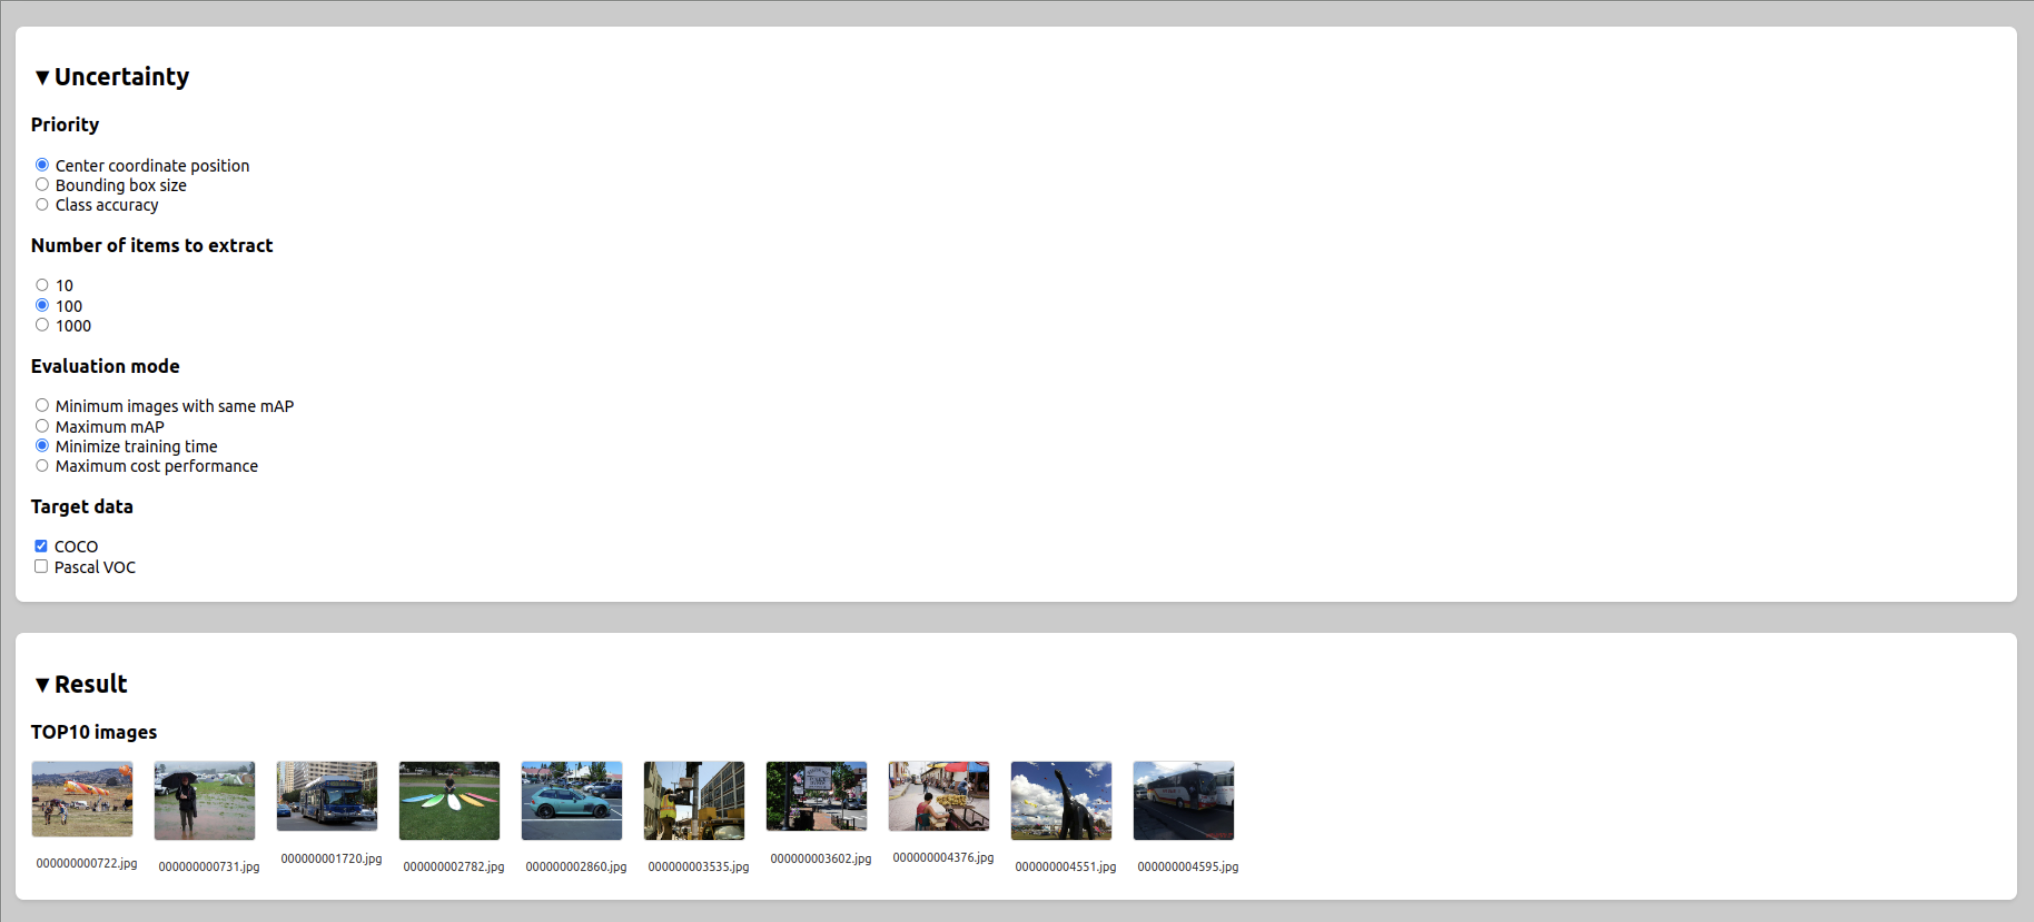
The core of the technology: Mechanisms for visualizing uncertainty
This tool analyzes data using its own unique workflow.
Calculation of analytical data (quantification of uncertainty)
The trained model is given multiple input data sets to perform inference, and feature data and uncertainty index data are calculated for each data set.
In this tool's object detection process, an uncertainty metric that focuses on the variability of inference results is used to understand the model's indecision.
In this context, uncertainty refers to how stably the model is able to make decisions regarding its input. For example, if you perform multiple inferences with Dropout enabled, the output will tend to be relatively stable for subjects that the trained model understands well. On the other hand, for patterns or corner cases where the model is not sufficiently trained, there may be variability in the output trends for each inference.
This tool utilizes such fluctuations to understand uncertainty. Data with large fluctuations in output may indicate that the model is not sufficiently confident, making it a good candidate for additional training.
Displaying data distribution through dimensionality reduction
By compressing high-dimensional feature data into 2D or 3D dimensions that are easier for humans to understand, tens of thousands of data points can be viewed as points on a map. Dimensionality reduction techniques such as t-SNE and UMAP can be used.
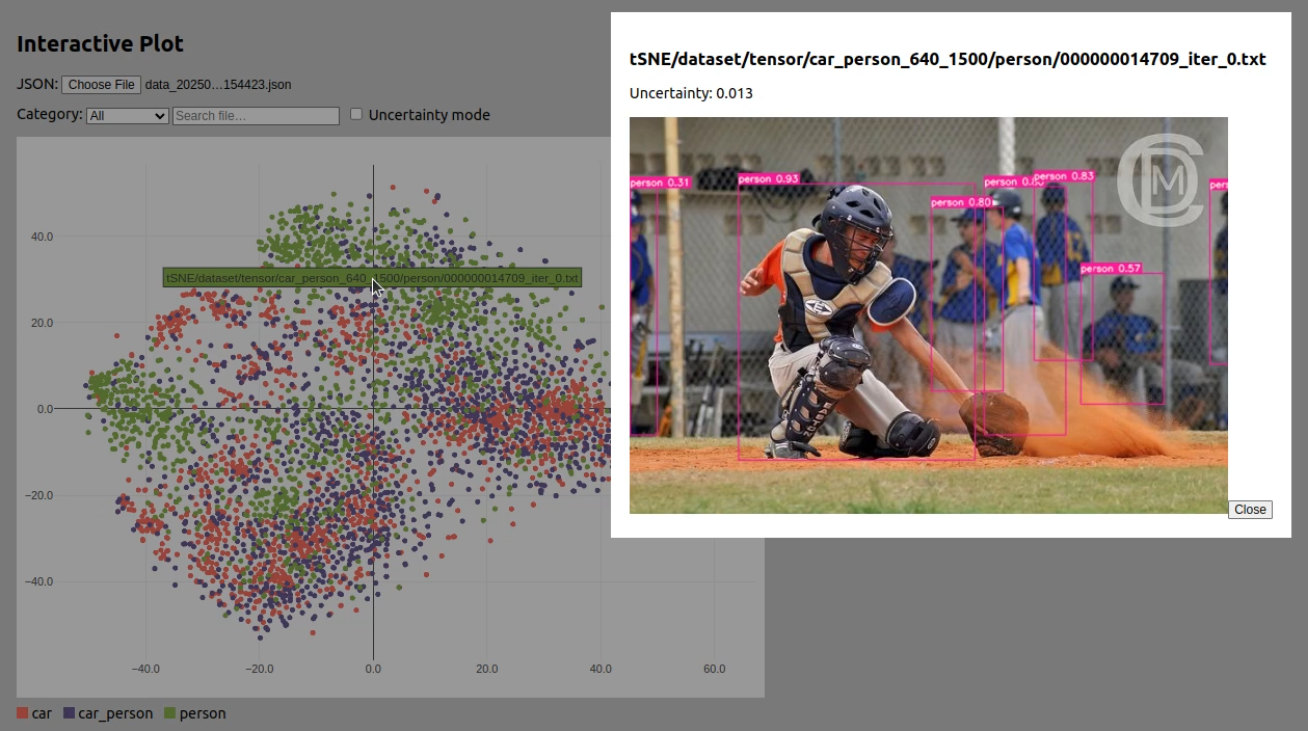
The following screen is an example of a development screen for the Active Learning tool. By clicking on each dot plotted on the 2D plane, you can view the actual image and detailed data. You can also refer to the uncertainty index Unc and the surrounding density Den.
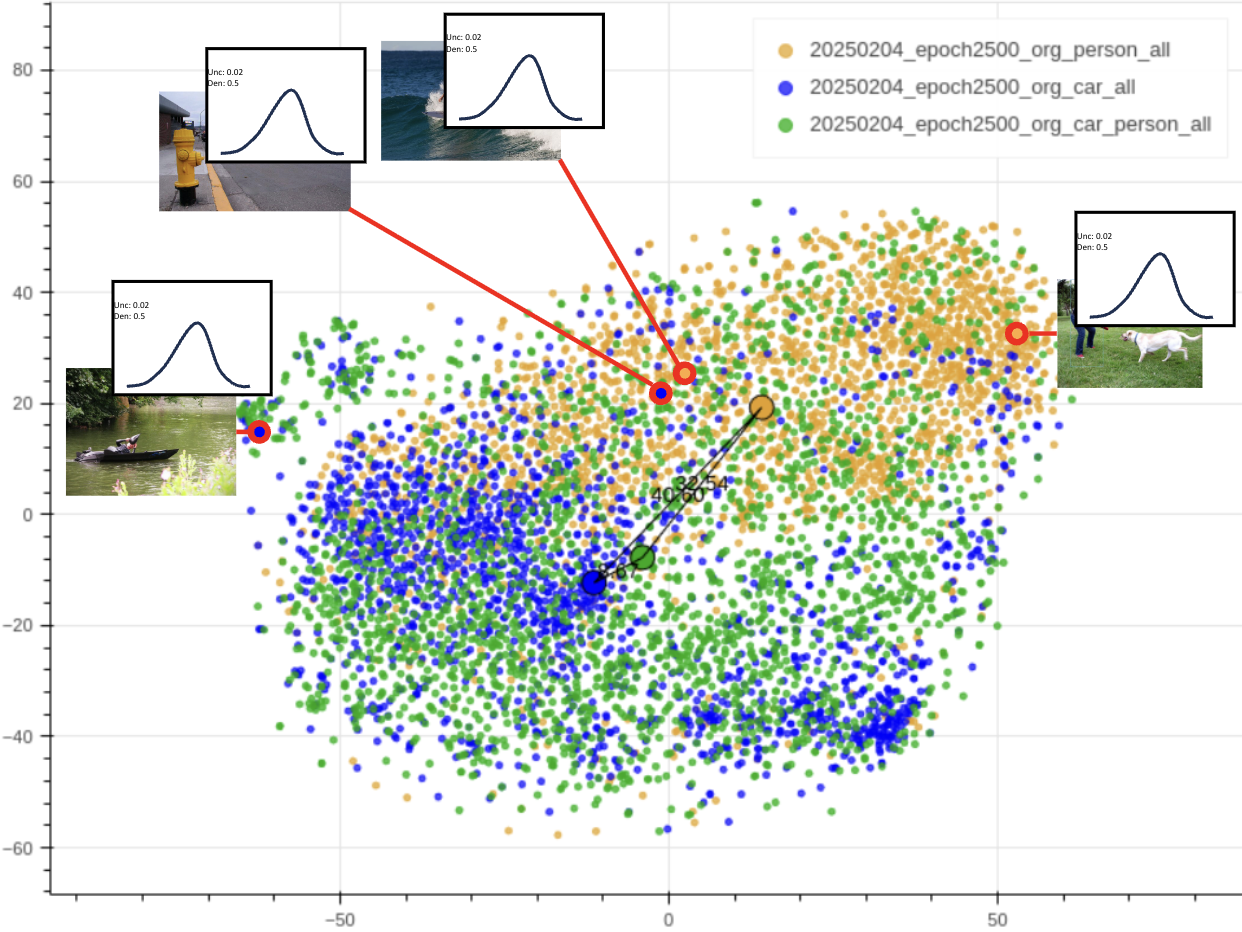
Strategic FILTERS display
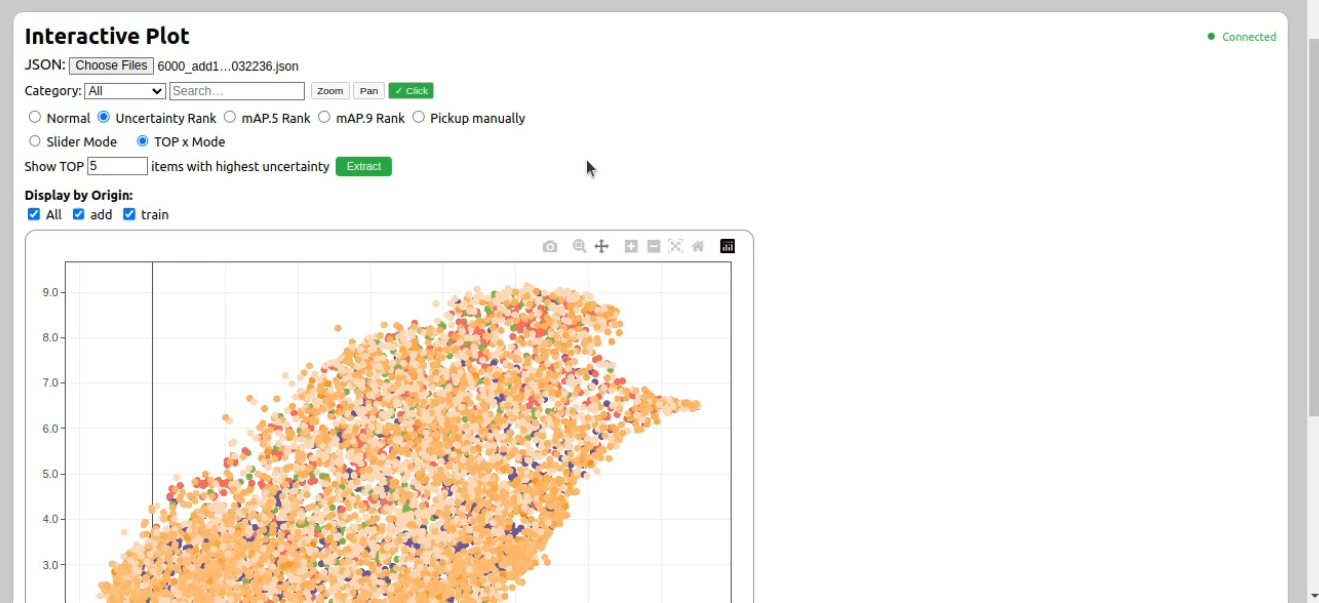
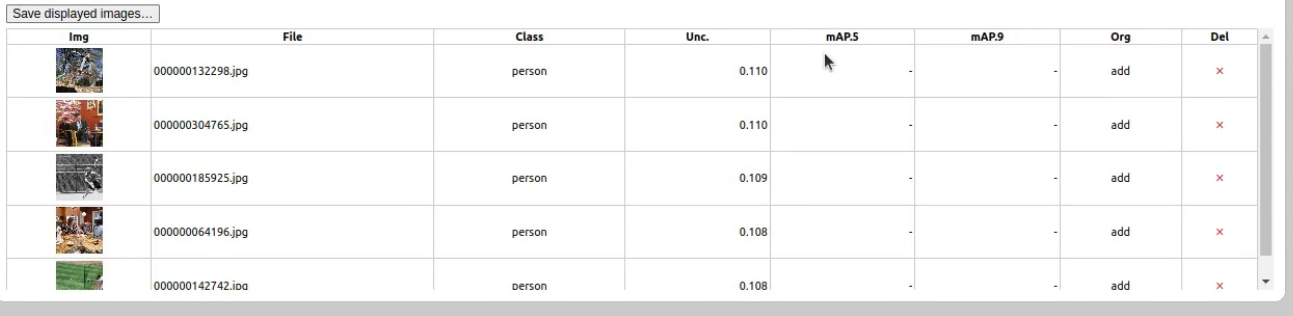
It supports highlighting specific labels and extracting images in order of highest uncertainty index, allowing for uses such as "collecting only images that AI struggles with and focusing on strengthening that area."
The following is an example of a development screen for the Active Learning tool. You can FILTERS by image category and highlight the target data.
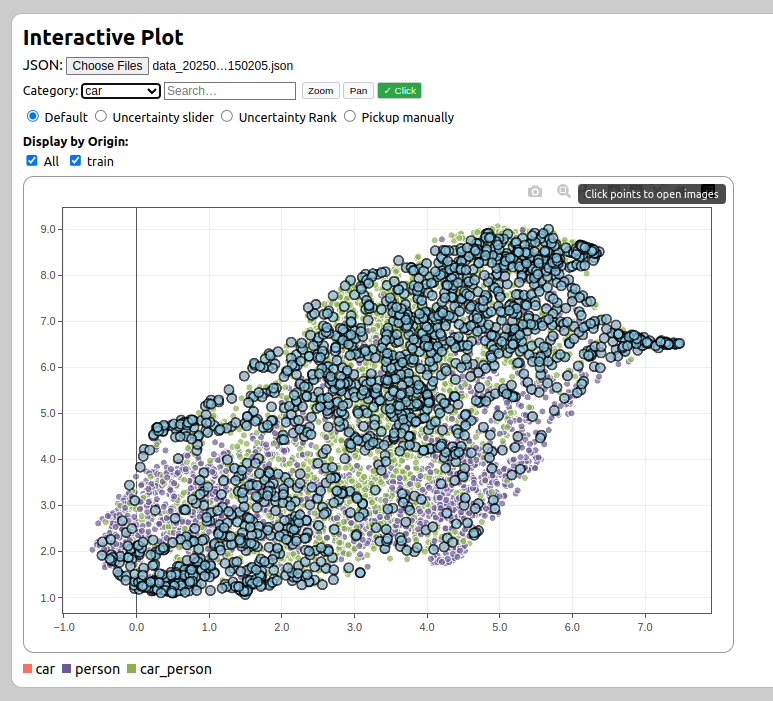
↑This is what it looks like after FILTERS by the label "car". The distribution appears to be concentrated relatively towards the upper right.
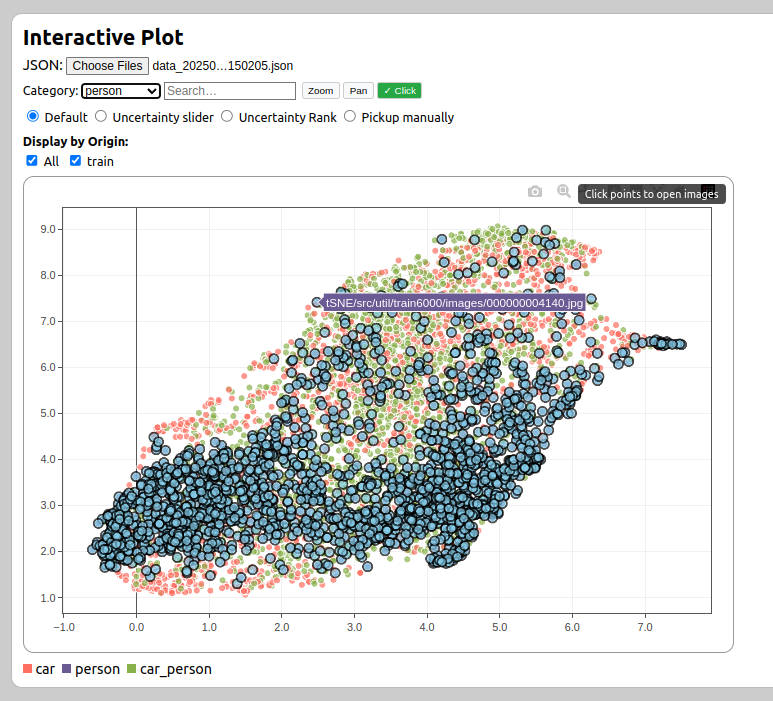
↑This is what it looks like after FILTERS by "person". The distribution appears to be concentrated relatively towards the bottom left.
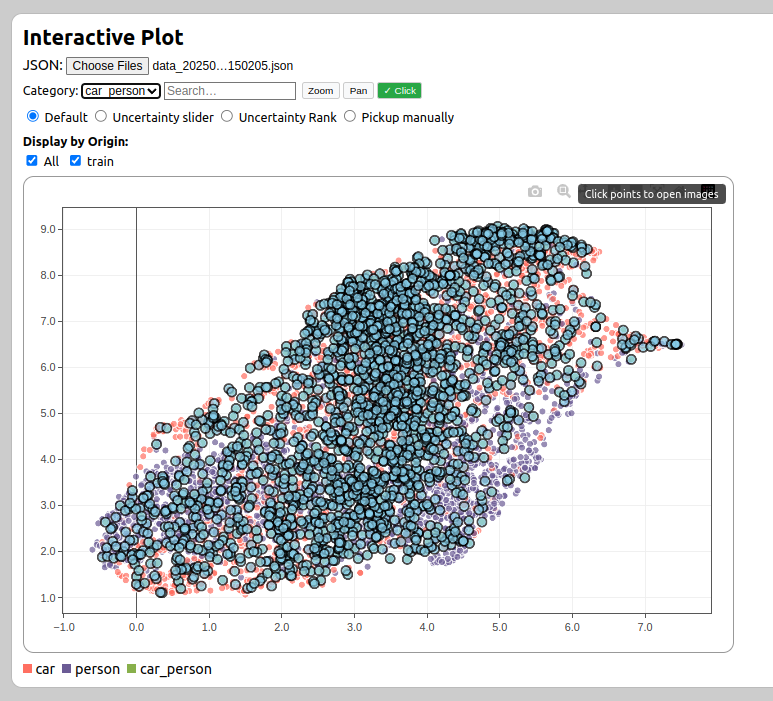
↑This shows the results after FILTERS by the label `car_person` (images containing both cars and people). The data appears to be distributed fairly evenly overall.
Integrated display with previously trained data
By displaying both previously trained and untrained data simultaneously, it's possible to identify untrained gaps between the trained areas. Prioritizing the reinforcement of these areas reduces the model's blind spots and efficiently improves recognition accuracy.
The following is an example of mapping using t-SNE with COCO data, highlighting each condition in red. This is also a screenshot of the Active Learning tool under development.
-
All: All
-
Car_Person: A mix of cars and people
-
Person: Human only
-
Car: Car only
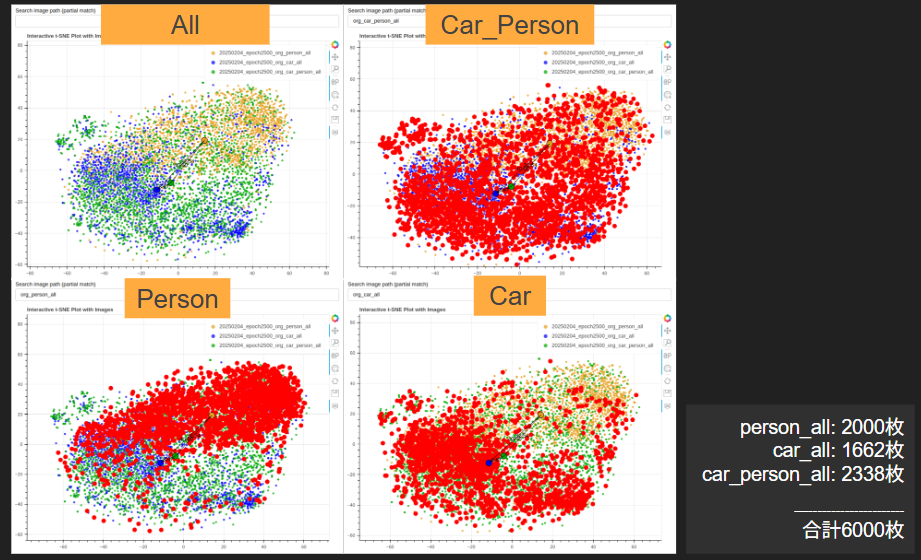
In "All," you can get an overview of the overall distribution trend.
In the Car_Person dataset, points are present across the entire distribution, indicating that data containing both cars and people spans a wide feature region. Furthermore, in the upper left, we can see a distribution resembling a subcluster, slightly distanced from the larger dataset.
Persons tend to be concentrated in the upper right corner.
Cars tend to be concentrated in the lower left corner.
After confirming the distribution in this way, it becomes possible to, for example, focus on images around subclusters, add new data to those regions, or perform augmentation to improve versatility.
OTHERS features
-
FILTERS function using uncertainty indicators
-
Function to extract candidate training data for the next training period in order of uncertainty index
-
Function to extract candidate training data for the next training session in mAP@0.5 / @0.9 order.
-
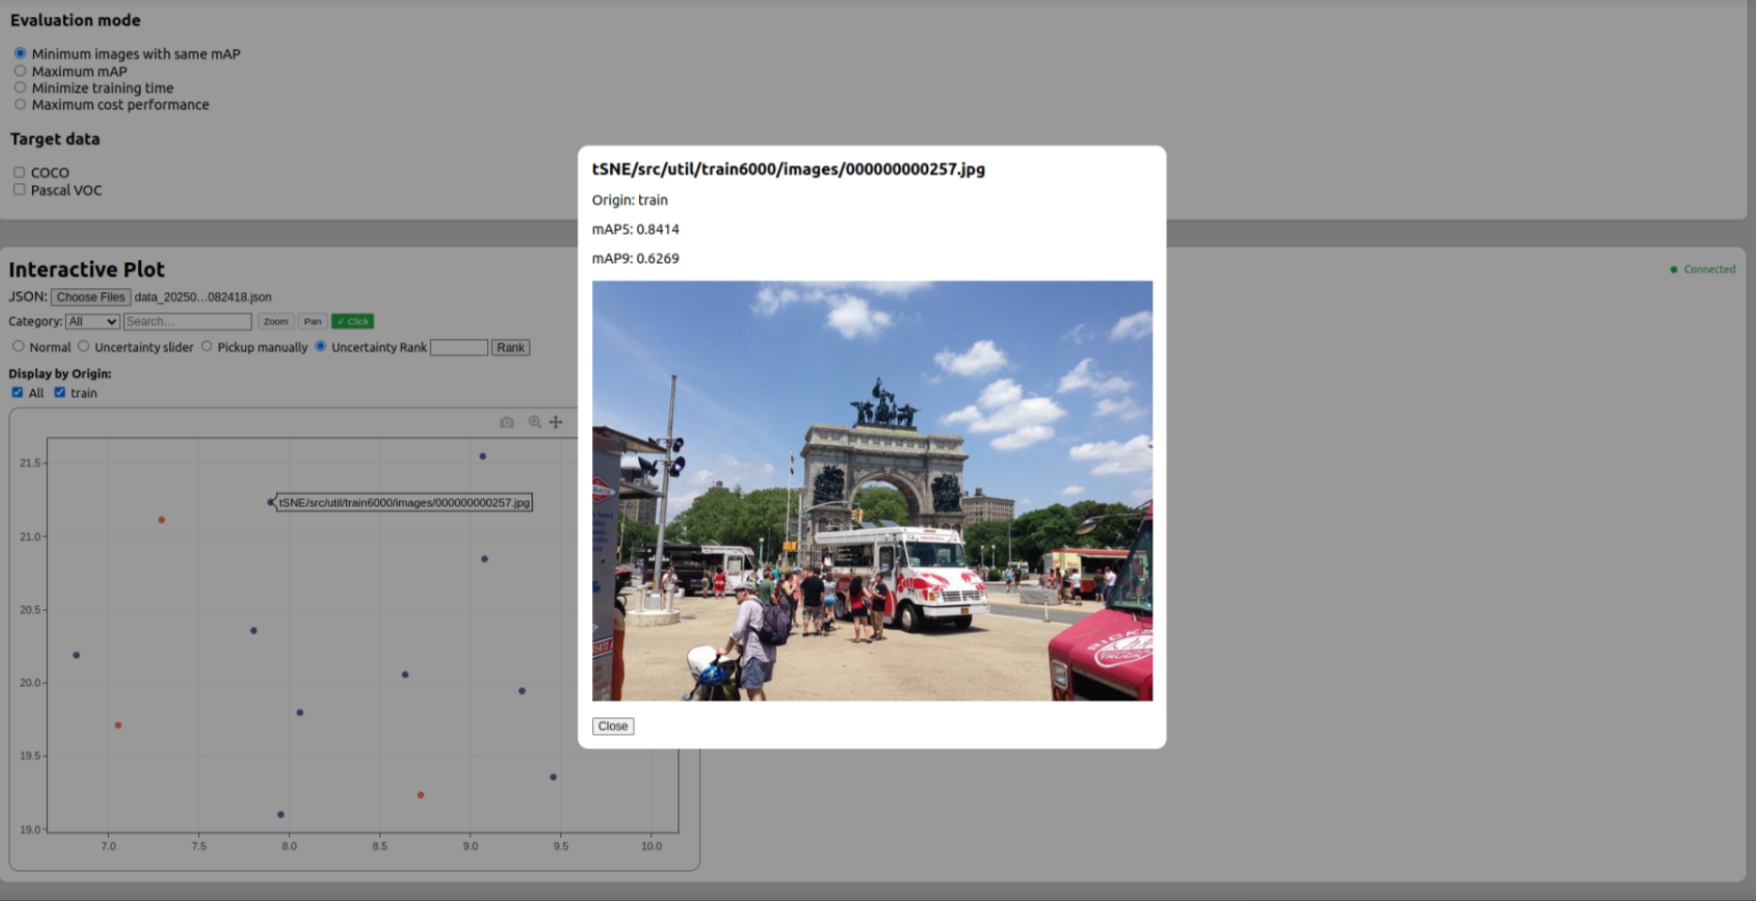
Detailed preview of each data point, manual extraction function.
The following is an example of a development screen for the Active Learning tool.
Benefits of implementation: Improved quality
We compared the accuracy before and after using this tool and confirmed a trend of improvement in inference accuracy.
After using 6,000 images for initial training, we compared different methods for selecting additional training data. We found that prioritizing data with high uncertainty yielded better results compared to other selection methods.
| Learning conditions | mAP@0.5 | Difference from the first time | Features |
|---|---|---|---|
| Initial learning (6000 pages) | 0.7386 | 0 | The initial learning session serves as the benchmark for comparison. |
| Additional training (6000 images + (Uncertainty bottom 1000 images) | 0.7351 | -0.0035 | Under these conditions, the results were lower than the initial training. |
| Additional training (6000 images + (1000 random cards) | 0.7452 | 0.0066 | Some improvement was observed. |
| Additional training (6000 images + (Top 1000 uncertainties) | 0.7499 | 0.0113 | This was the highest value among those compared. |
These results suggest that prioritizing the selection of data with high uncertainty may lead to efficient accuracy improvements. However, since the difference can vary depending on the evaluation conditions and the structure of the dataset, the same trend may not always be reproduced.
Therefore, this tool is effective not only for simply looking at the magnitude of accuracy differences, but also for visualizing areas where the model tends to get confused and gaps in its learning process, and for determining which data to prioritize for review and additional training next.
Summary: Towards data-centric AI development
AI development will shift from simply "gathering data" to "smartly selecting data." Our Active Learning tool is designed to support this change.
-
Shortening the development period
It reduces unnecessary annotation and training time, and supports efficient data selection. -
Cost reduction
By optimizing the amount of training data, you can reduce GPU resources and computing time. -
Justification for quality
Because it's possible to objectively demonstrate which areas have been strengthened based on visualized data, quality assurance becomes easier.
This tool is a partner that enables AI engineers to make data-backed decisions rather than relying solely on intuition.
If you are interested, please Inquiry via the inquiry form.